

Are you planning to launch a Facebook Ads campaign or are you already running your first advertising campaigns on Facebook? Then you should keep an eye on the most important key performance indicators for your Facebook Ads. Because only those who check the most important key performance indicators (KPIs) on a daily basis – and try to optimise them – will be successful with their advertising campaign on Facebook.
Facebook Ads: You should know that as a beginner
In my article „How to start your first Facebook Ads campaign – Instructions for beginners “, I have already shown you how to set up a Facebook Ads campaign within a very short time.
Of course, simply creating such an advertising campaign is not enough: Facebook provides you with numerous key performance indicators (KPIs) in the Ads Manager, which you can use to monitor and analyse your current Facebook Ads campaign. It would go beyond the scope of this article to go into all the KPIs available there.
You don’t need to know all the key figures in detail, at least not at the beginning. However, there are some key figures that should be included in every evaluation or report so that you can analyse your advertising campaign or adverts in depth.
General account overview in the ad manager
If you open the Facebook Ads Manager, you will get an overview of your account in the dashboard. You can already see some interesting key figures there.
However, the KPIs listed there relate to all campaigns that you have created within your advertising account. You can see the reach, the amount spent, the impressions and the link clicks of the campaign for a period of your choice.

You can also find statistics on this page – for example on age, gender and location.

However, these are of course only general KPIs for your advertising account. However, if you want to view the key figures of your Facebook Ads campaigns in detail, you must call them up in the “Ads” level.

I have summarised below which key figures or KPIs you should keep an eye on and what they mean. Let’s get started!
The 9 most important Facebook Ads KPIs at a glance
To display these key figures within your ad manager, you need to customise the columns accordingly. This is very simple: Click on “Columns” in the toolbar and then on “Customise columns”.
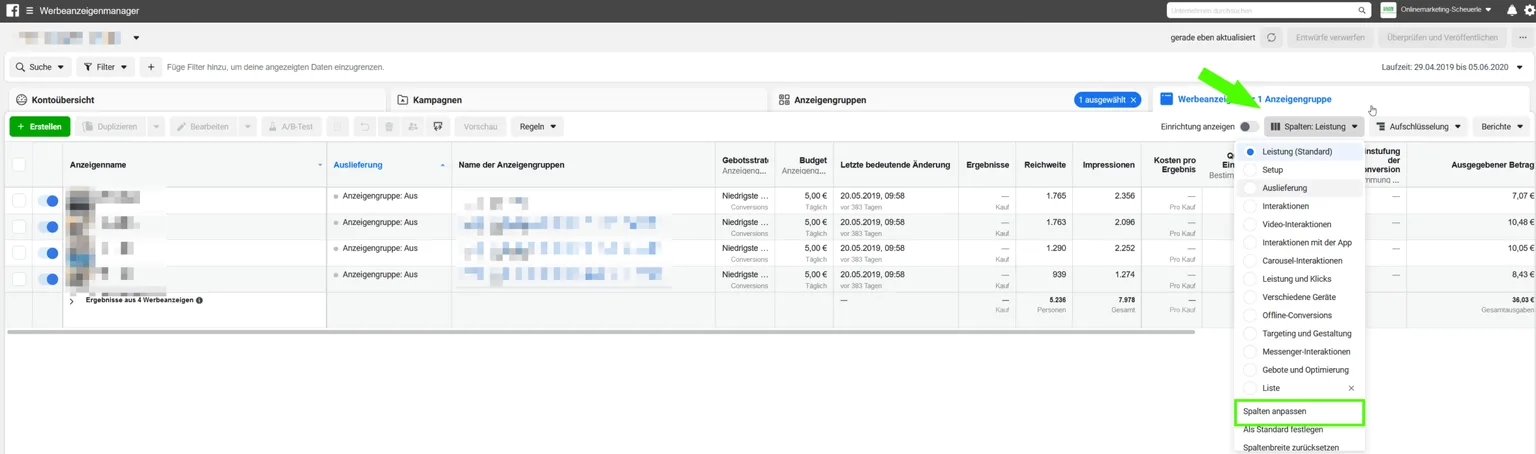
Important: Please save the column customisation so that you can call it up again at any time – with just one click.
Impressions
The impressions indicate how often an advert was played and seen by your target group. In other words, you find out how many individuals in your target group have seen your advert on the “screen”.
Upselling, cross-selling & measuring success
Discover how to effectively measure and boost cross-selling opportunities with actionable strategies tailored for agencies and freelancers on the Raidboxes blog.
Frequency
The frequency shows you how often your advert was displayed on average to a person within your target group. Please note: This is an approximate estimate on the part of Facebook.
The frequency value is a key figure that you absolutely must keep an eye on. If the frequency is too high, you can assume that your ads will no longer be recognised by users. This increases the cost-per-click, as the ad is clicked less and less.
This is also referred to as banner blindness: the more often a user sees your advert, the more often it is “ignored” or overlooked. A still acceptable frequency value is between around three and five. Of course, you must always check this individually for each advertising campaign.
CTR: Click-Through-Rate (click rate)
The CTR (click-through rate) is an important indicator and component for the evaluation of the advert. This is because it compares the ratio of clicks to impressions of the advert.
The CTR is calculated as follows:
Total number of clicks on the display ÷ Number of impressions
The higher the CTR value, the better the advert works.
CPC: Cost-per-click (cost per click)
The CPC (cost-per-click) indicates the value that you are charged with a click on the advert, or what a click on your advert costs you on average. With the help of these KPIs, you know exactly how expensive an action (click, visit to your website, etc.) is.
The CPC is calculated as follows:
Total amount of current campaign ÷ Total number of clicks
The higher the CPC, the worse your advert performs. The aim must therefore be to keep the CPC as low as possible.
ROAS: Return on Ad Spend
The abbreviation “ROAS” stands for Return on Ad Spend and is a key figure that can be used to calculate the actual profit achieved in relation to advertising expenditure.
ROAS is a sub-area of ROI (return on investment) and is generally determined on Facebook using the conversion value stored.
The formula for the ROAS looks like this:
(Win ÷ advertising costs) × 100
The aim of a successful advertising campaign should be to achieve the highest possible ROAS. Among other things, this provides information about the effectiveness of the current advertising campaign.
CPA: Cost-per-action (cost per action)
The CPA defines the cost per action divided by the cost per result. A key figure that reflects the desired behaviour of a user. In other words, this value indicates how much an action, for example a lead, purchase or other event, costs you on average per user (conversion).
CPM: Cost-per-mille (cost per 1,000 impressions)
The CPM is used to measure the costs per thousand impressions. This value is often used to measure the success of the campaign and to compare it with other campaigns.
The CPM is calculated as follows:
(Total cost ÷ number of impressions) × 1.0000
Ad relevance
The so-called ad relevance of an advert used to consist exclusively of one value, namely the “relevance score”. Facebook has now subdivided this value into 3 metrics, which significantly simplifies the evaluation of the advertising campaign.
Instead of the relevance rating, you can now use the quality rating, the engagement rate ranking and the conversion rate ranking. How exactly these values are actually determined by Facebook is not known.
Quality categorisation
The quality rating indicates the value of the advert for the selected target group. The rating is calculated according to how often a user has viewed or hidden the advert. This is to ensure a certain quality of the advert.
Engagement rate ranking
As the name suggests, this value is intended to determine the so-called “engagement” of users. In other words, how often the advert is clicked on, shared, commented on, etc.
Conversion rate ranking
The conversion rate ranking is an indicator that shows how high the expected conversion rate is and how high the probability is that a user will trigger a conversion – which is specified in the campaign objective. This value is also compared with ads with the same optimisation goal.
Link clicks
Link clicks give you a rough way of measuring the interest of your target group in your advert. The more link clicks your advert has, the more popular it is. However, all link clicks that are made within your Facebook advert are measured.
This indicator is therefore quite general, so you should always use other KPIs for the evaluation.
Amount spent
One value that should not be forgotten in a Facebook Ads campaign is, of course, the amount spent. This always informs you how much you have spent on the advertising campaign over a certain period of time and what total amount you will be charged by Facebook.
Interactions
Another way to view the success of an advert is, of course, the general interactions within the advert. In concrete terms, this means how often the advert is liked, shared or commented on.
Of course, this also has an influence on the value Facebook assigns to the advert – and how successfully it is ultimately displayed (see also the previously mentioned ad relevance).
Conclusion
I think you can now see that placing Facebook Ads is one thing and monitoring the campaign or the individual adverts is another important factor for the success of your campaigns.
The above-mentioned KPIs, which you can use in the Ads Manager, help you to carry out informative analyses. Of course, Facebook offers you many more options and KPIs if you want to run video ads, for example.
Which KPIs are essential for you?
What questions do you have about Sven about Facebook Ads and social media success measurement? Feel free to use the comment function. For more insights on WordPress, web design or online business, follow Raidboxes on Facebook or LinkedIn – or subscribe to our newsletter.
Leave a Reply